


The statements made and opinions expressed in this publication are solely the responsibility of the author(s) and do not necessarily reflect the opinions of the Security in Context network, its partner organizations, or its funders.
By Rhys Jenkins
This paper was prepared for the online conference, The China Effect: Rethinking Development in Latin America and the Caribbean, that took place on December 3, 2025, and organized by the University of Oklahoma Center for Peace and Development, the Security in Context Network (SiC), and the Center for Chinese Mexican Studies (Cechimex) at the School of Economics at the National Autonomous University of Mexico (UNAM).
Revised version of a paper presented at the international seminar, “The China Effect: Rethinking Development in Latin America and the Caribbean,” 3 December 2025.
Citation: Jenkins, Rhys, 2026. “Is the US Pushing Latin America into the Arms of China? The Economic Dimension,” Security in Context Research Paper 26-03. May 2026, Security in Context.
Introduction
The US National Security Strategy (NSS) in November 2025 called for a renewal of the focus on the Western hemisphere and a reassertion of the Monroe Doctrine in Latin America (LA). The US operation in Venezuela to remove President Maduro and take control of Venezuelan oil is a first realization of the aims of the NSS.
The NSS states that:
“We will deny non-Hemispheric competitors the ability to position forces or other threatening capabilities, or to own or control strategically vital assets, in our Hemisphere. This “Trump Corollary” to the Monroe Doctrine is a common-sense and potent restoration of American power and priorities, consistent with American security interests.” (US, 2025, p.15)
Although not mentioned by name, a clear target is China whose growing presence in Latin America has been a concern for the American Right for some time. A widely held view has been that since 9/11, the US has neglected Latin American and the Caribbean (LAC) and allowed the growth of Chinese influence in the region (Hakim, 2006). Although others have disputed this view (Long, 2016; Milani, 2021), the NSS refers to “years of neglect” of the Western Hemisphere by previous governments. It argues that:
“Non-Hemispheric competitors have made major inroads into our Hemisphere, both to disadvantage us economically in the present, and in ways that may harm us strategically in the future. Allowing these incursions without serious pushback is another great American strategic mistake of recent decades.” (US, 2025, p.17)
The geo-political strategy of the Trump administration is to reassert US hegemony in the region. However, it is not clear how successful their policies will be in terms of reducing Chinese influence in Latin America or whether in practice they will lead to countries developing closer links with China.
Following Trump’s return to the White House several different views have emerged regarding the implications of his policies for the relations between the US, China and Latin America. Some commentators argue that “China’s Inroads Are Encouraging Stronger US Ties” (Segal, 2025) and that “Trump is breaking China’s foothold in Latin America” (McFields, 2025). In contrast, others claim that the policies of the Trump administration are leading to LA countries developing closer links with China and reducing US influence in the region (Ellis, 2025a and 2025b). A third view emphasizes differences within the region with some countries moving closer to the US (e.g. Mexico) and others relying more heavily on China (Brazil) (Estefan, 2025).
In this paper we focus on the development of economic links, particularly trade between LA and China, and consider how these could be affected by current US policies. Have links between LA and China become closer while those with the US have weakened and if so, is this a result of Trump’s policies? Is there a contradiction between the US government’s economic strategy that may undermine US-LA economic relations and lead to increased Sino-LA links, and the geo-political strategy which aims to reduce China’s influence and strengthen US hegemony in the region? If so, will this be reflected in divergences between different sub-regions in Latin America?
The Growing Presence of China in Latin America and US Hegemony
A recent book by Francisco Urdinez on Economic Displacement: China and the end of US primacy in Latin America highlights the extent to which the economic weight of China has increased relative to the US between 2001 and 2020 (Urdinez, 2025). Economic weight here is defined to include exports1 from Latin America to the US and China, aid, direct investment, and loans from the two countries to the region.
Given the significance of trade, particularly in terms of China’s relations with LA and the greater reliability and availability of data,2 this paper only considers changes in trade relations. In focusing on trade, both exports and imports are included since dependence on foreign imports can be as much a source of leverage over a country as market access for exports.
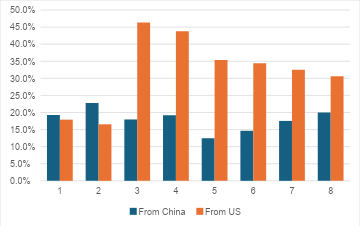
China’s share of LA trade increased rapidly during its first decade after joining the WTO in 2001 (see Figure 1(a)). The US share of LA imports and exports both declined by even more than China’s increased between 2001 and 2011, suggesting an overall loss of competitiveness. China’s share continued to increase after 2011, although more slowly, while the US share of LA imports stabilized and its share of exports recovered partially.
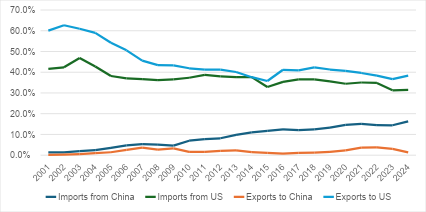
Marked differences existed between South America on the one hand and Mexico and the Dominican Republic-Central America Free Trade Agreement (DR-CAFTA) on the other. China overtook the US in terms of both South American exports and imports in 2015 (Figure 1(b)). However, to its closer neighbors, the US remains their most important partner. China’s share of exports is low and although the US saw its share decline significantly between 2001 and 2011, it has recovered slightly since then. China’s share of Mexican and DR-CAFTA imports increased throughout the period, while the US’s declined, although the latter remains the most important source of imports (Figures 1(c) and 1(d)).
Figure 1(a): Latin America Trade with US and China, 2001-2024 (% share)
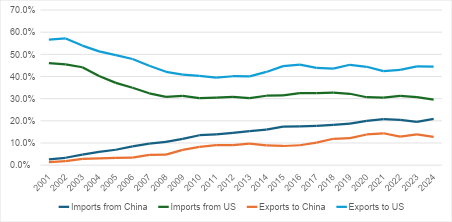
Figure 1(b): South America Trade with US and China, 2001-2024 (% share)
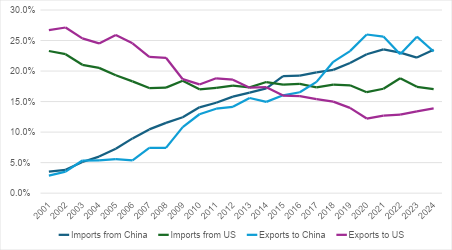
Figure 1(c): Mexico: Trade with US and China, 2001-2024 (% share)

Figure 1(d): Central America and Dominican Republic Trade with US and China, 2001-2024 (% share)
Analytical Framework
In order to analyze the potential impact of increased US protectionism and the trade war between the US and China on trade relations between Latin America and both the US and China, it is useful to distinguish between a number of concepts. The following concepts were originally developed in the context of the effects of trade agreements and customs unions but are equally relevant to analyzing the impacts of protection.
Trade destruction refers to a situation where trade between countries is reduced as a result of trade barriers (also referred to as negative trade creation). If the US raises tariffs across the board, trade will be reduced as imports become more expensive. This is associated with import substitution, as domestic production replaces previously imported products. After World War II, this result was a major rationale for protectionism in Latin America as governments sought to promote industrialization (Edwards, 2025). Reindustrialization has also been an important objective for the Trump administration’s adoption of protection. It is also important to note that policy uncertainty can lead to trade destruction as firms may be reluctant to make long-term investments to serve export markets where access may change in the future (Douch et. al., 2019)
Trade diversion arises where protection diverts imports to countries facing lower trade barriers. It is possible that if trade barriers only apply to certain exporters, or are applied at different rates across countries, then importers will switch supply from those countries subject to high trade barriers to those countries which continue to enjoy more favorable market access. During the first Trump presidency, the trade war against China meant that other countries enjoyed more favorable access to the US market, opening the possibility that they would benefit from US imports diverted away from China. Similarly, retaliation by China against the US could divert Chinese imports from the US to other suppliers. The “reciprocal tariffs” imposed by the US in 2025 also differed between countries, creating the potential for trade diversion.
Trade deflection arises where exporters switch to markets where they face lower trade barriers. When one country imposes trade barriers, exporters in partner countries may choose to redirect their exports to other markets that have not raised tariffs. The US-China trade war, for example, led to concerns in Europe that they would face a flood of Chinese goods diverted from the US market (Gunnella et. al., 2025). Equally, US exporters affected by Chinese retaliation could try to find alternative markets for their products that no longer had access to the Chinese market.
Finally, Rerouting occurs where exporters ship goods through third countries in order to take advantage of lower trade barriers than would be faced if they exported directly. This may involve some investment in the third country to carry out a minimal amount of processing. For example, Chinese companies could export products from China to subsidiaries in Vietnam. These subsidiaries then re-export the finished product to the US where tariffs on Vietnamese goods are lower than those on products imported directly from China (Iyoha et. al., 2025).
For individual countries, whether trade increases or reduces depends on the balance between these different effects. Trade destruction will always lead to a reduction in bilateral trade. Trade diversion will increase trade with countries that enjoy lower tariffs in the importing country and reduced trade for others. Trade deflection increases trade between the countries that are targeted by the protectionist country and other markets. Finally rerouting can increase trade between the third market through which goods are rerouted and both the importing and exporting countries.
US Trade Policies under the First Trump Presidency and Their Impacts on Latin America
During his first administration President Trump launched the trade war against China. Beginning in 2018, the US imposed tariffs of 25% on $50 billion of Chinese goods, to which China responded with a 25% tariff on a similar amount of imports from the US. The proportion of Chinese exports subject to US tariffs rose to almost half by the end of 2018 and two-thirds by the time Trump left office at the start of 2021. Chinese retaliation covered almost 60% of US exports. The US tariff rate on imports from China was about 19.3% on average by 2020 while Chinese tariffs on US goods were slightly higher (21%) (Brown, 2025).
In addition to the extensive tariffs on Chinese goods, the US also introduced duties on some specific products, most notably steel and aluminium. Latin America was not targeted specifically and Argentina, Brazil and eventually Mexico were exempted from the steel and aluminium tariffs. Tariffs were threatened on other Mexican products but never applied (Harrison and Gerbaud, 2025). Chinese retaliation was focused exclusively on US imports.
Since neither the US nor China imposed additional restrictions on LA exports, there was no direct trade destruction in relation to trade with the region. The relevant impacts on the region therefore involve trade diversion, trade deflection and rerouting. Several studies have provided evidence of these effects on LA as a result of the trade war launched during the first Trump administration.
Impacts on US-Latin American Trade
Diversion of US imports from China to LA
Countries which stood to gain from this effect were those competing most directly with China in the US market. There is strong evidence that Mexico benefitted from the diversion of US imports from China (Nicita, 2019; Fagelbaum et. al., 2023; Wand and Hannan, 2023: Utar et. al., 2025),3 as Mexico’s share of US imports increased from 13.1% to 14.1% (2017-2019). There are also indicators that the Central American countries and the Dominican Republic stood to gain from restrictions on Chinese exports.4 The Inter-American Development Bank (IADB) (2025) lists El Salvador and Honduras as the countries after Mexico with the highest proportion of exports to the US of products on which tariffs on Chinese goods were imposed. However, the evidence that these countries gained market share in the US as a result of the trade war is less clearcut than for Mexico.5 Nicita (2019) found that exports from LA countries other than Mexico, Brazil, and Argentina only increased by $30 million.
Deflection of US exports from China to Latin America
In contrast to trade diversion of US imports, there is no evidence of significant deflection of US exports to Latin America. This is not surprising since the main products exported from the US to China are agricultural products, fuels and sophisticated manufactured goods, particularly machinery, for which there is limited demand in the region.
Rerouting of Chinese exports to the US via LA
Rerouting involves a change in the structure of global value chains so that instead of China exporting goods directly to the US, they pass through third countries where some transformation may occur. Part of the diversion of US imports to Latin America may reflect such rerouting.
Although data is limited, there is some evidence that this occurred in the case of Mexico (Alfaro and Chor, 2023; Huang and Lewis, 2024; Haberkorn et. al., 2024). However, the extent of rerouting, as opposed to diversion, appears to be relatively limited and there is no evidence that it has occurred in other countries beyond Mexico.
Impacts on China-Latin America Trade
Diversion of Chinese imports from US to LA
This mainly affected countries that competed with the US in the Chinese market in products targeted by China to retaliate against US import restrictions. Exporters of agricultural products, particularly soybeans and pork were the main beneficiaries. Laborde and Piñeiro (2019) show Mercosur as the largest gainers in terms of agri and agro-food exports. The IADB (2025, p.9) shows Brazil, Argentina, Chile, and Colombia, gaining from increased demand as a result of Chinese retaliation. United Nations Conference on Trade and Development (UNCTAD) data shows that the share of South America in China’s imports increased from 6.2% to 7.1% (2017-2019), accounted for mainly by Brazil, Argentina and Chile.
Deflection of Chinese exports from the US to LA
Trade deflection occurs where Chinese exporters faced with higher trade barriers in the US choose to increase their exports to other countries. The most likely target countries will be those that have a similar pattern of demand to the US. Evenett and Martin (2025), include three LAC countries (Argentina, Brazil, and Mexico) in their analysis of trade deflection during the first Trump administration. Of these, only Mexico shows evidence of trade deflection of Chinese products which were subject to increased protection in the US between 2017 and 2019. The EU was a far more significant market for Chinese exports deflected from the US.
Rerouting of Chinese exports via Latin America
Part of what appears as deflection of Chinese exports to Latin America may reflect rerouting so that products imported from China are destined for the US rather than local markets. While the extent of rerouting to the region is limited, apart from the case of Mexico, it did play some role in increasing Sino-Latin American trade during the first Trump administration.
Overall Impact on Latin American Trade
There is evidence that the US-China trade war did affect Latin America during the first Trump administration. In South America, policies led to closer relations with China as a result of increases in exports. Mexico and Central America were drawn more into the US sphere as they increased their shares of the US market, with the caveat that some of these exports may have been the result of increased imports or investment from China.
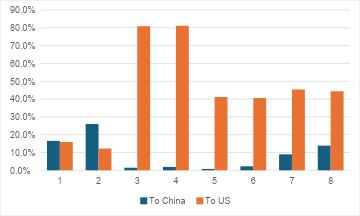
As a result, the overall share of South American exports going to China increased while the US’s share fell. Figure 2 shows that whereas China has overtaken the US as the main market for South American exports, the US continues to be substantially more important for Mexico and the DR-CAFTA countries which show little shift towards China.
Figure 2: Share of Latin American exports to China and USA: 2016 vs. 2020
In the case of imports, the pattern is more similar across sub-regions with China gaining and the US losing market share (Figure 3). This reflects the long-term trend of increased Chinese competitiveness rather than any specific policies adopted by the Trump administration.
Figure 3: Share of Latin American Imports from China and USA: 2016 vs. 2020
Trade Policies during the Second Trump Presidency
In his second term Trump has adopted a more generalized protectionist strategy, not just focused on China. He announced reciprocal tariffs on all countries in April 2025 in addition to specific sectoral tariffs on steel, aluminium, copper, cars and parts, and timber. Certain countries including Canada, Mexico, Brazil, China and India were also subject to country-specific tariffs.
In Latin America, the highest tariff rates were on Brazil (50%) and Mexico (25% for non-USMCA compliant products). Nicaragua faced a tariff of 18% and Venezuela, Guyans, Costa Rica, Ecuador, and Bolivia, 15%. All the other countries in the region faced the universal tariff rate of 10%.6
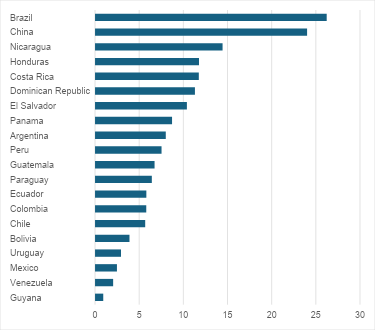
These nominal rates differed from the effective tariff rates that take into account the composition of each country’s exports and any sector-specific tariffs and exemptions. When these are calculated, again Brazil faces the highest tariff rate at 26.2%, while Mexico’s is third-lowest at 2.5%. The DR-CAFTA countries (apart from Guatemala) range from 14.4% in Nicaragua to 10.4% in El Salvador. The remaining South American countries have effective tariffs of between 5% and 10%, while the lowest rates are for Venezuela (2%) and Guyana (<1%) (Figure 4).
Figure 4: Added Effective tariff rate, November 21st 2025 (%)
In November 2025, trade deals with El Salvador and Guatemala lifted reciprocal tariffs on some textile and apparel products that met DR-CAFTA rules of origin. Tariffs have also been removed on imports of over 200 food products including major LA exports to the US like bananas, beef, coffee, and orange juice.
The tariffs imposed on US imports from China during the first Trump presidency led to the rerouting of Chinese exports via other countries such as Vietnam and Mexico. Under Trump 2.0 there have been efforts to prevent this. In July 2025 an additional tariff of 40% was imposed on any goods deemed to have been transshipped via a third country in order to avoid paying higher import duties.
Although tariffs on LA exports have increased, with the exception of Brazil and Nicaragua, the effective tariff rate is lower than for many other countries including China, India, Japan, South Korea, South East Asia and the EU.
Whereas the impacts of the Trump 1.0 tariffs on LA were relatively easy to predict because they only involved US tariffs on China and the retaliatory measures taken by China, the situation is more complicated today because the entire world has been directly targeted by US tariffs, leading to potential restructuring of global value chains.
Impacts of US Trade Policies on Latin America under Trump 2.0
It is still early to analyze the impact of Trump 2.0 on Latin American trade given the frequent changes in tariff measures during 2025 and the uncertainty over the legality of some tariffs that have been imposed. Nevertheless, it is possible to obtain some idea of whether these policies are weakening trade with the US and increasing links with China from the shifts in trade patterns that have occurred since Trump returned to office. This section considers some of these shifts and their different effects within Latin America.
Impact on US Trade with Latin America
Trade destruction
The imposition of tariffs by the US leads to trade destruction (sometimes referred to as negative trade creation). One UN estimate in May 2025 predicted that the total trade destruction would amount to $450 billion (Hinrichs Foundation, 2025) over a third of which is accounted for by China ($156.6 bn). Using the same data source, the total amount of trade destruction in Latin America as a result of US tariffs came to over $30 billion, $19 billion of which was accounted for by South America and over $11 billion by Central America (see Table 1). The total represented more than a fifth of the value of US imports from Latin America in 2023 and over 30% of Central American exports. However, these figures underestimate the actual likely impact on the region since Mexico is not included in the UN estimates and the effect on Brazil does not take into account the additional 40% tariff on Brazilian imports in July 2025.
Table 1: Estimates of Trade Destruction for Latin American countries as a result of US Tariffs (July 2025)

The actual impact of increased protectionism on US-LAC trade in 2025 will not match the projections from modelling since several other factors need to be taken into account. It has been observed that when tariffs are first announced or expected, importers will front-load their demand for foreign goods to obtain them before higher tariffs come into force, leading to a short-term boost in imports. This happened in the US in early 2025. The increased uncertainty created by the frequent announcements and changes in tariff rates during 2025 also made it less attractive for firms to undertake any long-term investments to supply the US market and establish supply chains.
Although there is evidence that the total level of US trade began to fall in 2025, it is not surprising that so far the extent of trade destruction has been limited compared to the projections. Between the final quarters of 2024 and 2025, US imports fell by almost $30 billion. If maintained over an entire year, this would represent an absolute reduction in trade of around $120 billion. Over the same period, imports from China fell by more than $50 billion, while imports from elsewhere actually increased (US Trade on Line). Imports from Latin America increased by around $6 billion (3.7%). Imports from Mexico grew by 6.7% year-on-year, while those from DR-CAFTA increased by 1.3%, while those from South America fell by more than 8%.
Trade diversion
For individual countries, trade destruction may be offset by trade diversion if they face lower tariffs than their competitors. On the other hand, for those countries facing relatively high tariffs, then the effects of trade destruction will be compounded by trade diversion. As was seen above, the effective tariffs faced by most Latin American countries in the US were at the lower end of the range imposed by the Trump administration.
The UN Trade Intelligence and Negotiation Adviser (TINA) simulation of the effects of US tariffs on Latin American exports show that overall, the region benefitted from trade diversion, although the impact is relatively small. In aggregate the total gain was over $900 million which represented 0.6% of the region’s exports to the US in 2023 (see Table 1). Some countries experience a negative trade diversion, despite the relatively low effective tariff rates for the region.7 In none of the countries where trade diversion is positive is it sufficient to offset the negative effects of trade destruction.8
Given the somewhat paradoxical results of the simulation predictions, it is useful to consider the emerging evidence on the actual impacts that changes in US trade policy have had on trade diversion during the first year of Trump’s second presidency. This also makes it possible to analyze the extent to which trade diversion from China has been a factor in increasing trade between the US and Latin America.
A first potential indicator of this is the relationship at the product level between increased US imports from the region and a reduction in US imports from China which saw its share of imports fall significantly. Between the 4th Quarter of 2024 and the 4th Quarter of 2025, China’s share of US imports fell by over 5 percentage points from 13.8% to 8.1%. Over the same period, Mexico’s share rose from 15% to 16.5%, and that of DR-CAFTA increased only slightly from 1.09% to 1.14%. On the other hand, the share of South America in US imports fell over the same period from 3.5% to 3.3%.
Since virtually all US imports from China were subject to trade restrictions during 2025, it is impossible to compare the performance of imports from Latin America in products where restrictions existed and those able to enter the US market freely. A more relevant comparison in this context is between products where imports from China fell and those where the level of Chinese imports increased or remained stable.
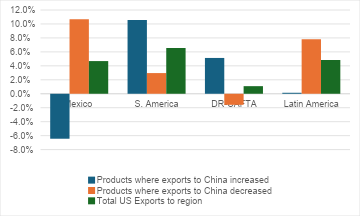
Figure 5: Growth of US Imports from Latin America according to Growth of Imports from China, 2024-25
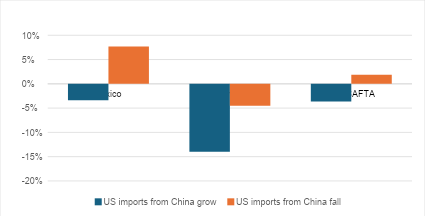
Figure 5 uses data on US imports at the four-digit HS level to divide products into those where imports from China grew and those where imports from China fell between the last quarter of 2024 and the same period in 2025. It then compares the change in US imports from Latin America in the two groups of products for each of the three sub-regions. In both Mexico and DR-CAFTA, US imports grew for products where Chinese imports declined and fell for products where Chinese imports grew. For South America, imports of both groups of products fell, but this was more marked for those where imports from China did not decline. This trend suggests that some of the growth of Mexican and DR-CAFTA exports to the US in this period was the result of the diversion of US imports away from China.
An alternative approach to estimating the impact of trade diversion from China to LAC uses an extension of Constant Market Share (CMS) analysis developed by Batista (2008) and applied to the effect of Chinese competition on Brazilian exports to the US by Jenkins (2014). CMS provides an accounting identity that divides the change in market share between a product composition effect and a competitiveness effect. The Batista extension divides the competitiveness effect between the countries from which a country is gaining market share (or to which it is losing market share). As the name suggests CMS focuses on changes in a country’s market share, but it can also estimate the effects on the total value of exports to a particular market.
This dynamic can be interpreted in terms of the impact of trade creation and trade diversion on a country’s exports. For example, the growth of Mexican exports to the US depends on the growth of total US imports of the products that Mexico exports and changes in Mexico’s share of those imports. When calculated in terms of the value of US imports from Mexico, these correspond to trade creation (or destruction if the value is negative) and trade diversion to Mexico from other countries. Since we are interested in the effects of the US-China trade war, we focus on trade diversion from China to Mexico.
In order to estimate these impacts, data on US imports at the four-digit level of the HS classification in the last quarters of 2024 and 2025 were used. This is the latest period for which data is available and the corresponding period before Trump was inaugurated. Over this period total US imports fell by 3.4% and imports from China fell by 44%.9 Earlier months in 2025 were not included because the main protectionist measures were only announced on 2 April 2025 (so-called “liberation day”) and the anticipation of and announcements about increased protection accelerated imports to bring goods into the US before tariffs were imposed.
Figure 6: Change in US Imports from Latin America: 2024-2025
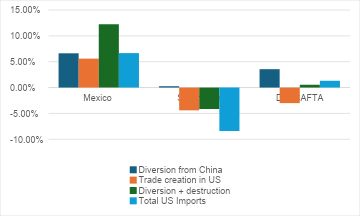
Figure 6 shows the impact of trade creation/destruction and trade diversion from China on US imports from three Latin American regions, Mexico, South America and the DR-CAFTA countries. Trade creation/destruction is estimated as the change that would have occurred in the value of imports if the region’s share of US imports of each product remained unchanged. It therefore captures both the effect of the overall growth of US imports and changes in the product composition of imports. Increased protection is expected to reduce the overall level of imports and may change the composition when they are applied at different rates across products or where there are differences in the extent to which local products can substitute for imports.
Trade diversion from China is calculated using the Batista method to estimate the extent to which changes in LA’s share of US imports can be attributed to reductions in China’s share. This is part of the overall competitiveness effect between Latin America and other exporters to the US.
Figure 6 shows quite different patterns in the three sub-regions. Mexico saw a large increase in trade diversion from China and a positive effect of increased US imports of the products that it exported (i.e. trade creation).10 Both the other regions experienced trade destruction with a drop in US imports of the products in which they specialized. However, in DR-CAFTA’s case this was offset by diversion of US imports from China to the region, so that overall, there was a small increase in US imports from the region. In contrast, there was little diversion from China to South America and a far larger impact of trade destruction, leading to a fall in US imports from the region. This was reflected in the overall growth of US imports with Mexican exports growing by 6.7%, DR-CAFTA by 1.3% and South America’s falling by 8.4%.
(ii) Deflection of US exports from China to Latin America
Another factor which affects trade relations between Latin America and the US is the degree to which US exports to China have been deflected to the region. There is no evidence of this taking place during the first Trump presidency, which is not surprising given that the products that the US exports to China are not ones where Latin America is a major importer.
Figure 7: Growth in US Exports to Latin America according to US Exports to China: 2024-2025
Looking at the region as a whole, US exports have grown in products where exports to China decreased. However, the situation differs across sub-regions. In Mexico the pattern is consistent with deflection of US exports from China to Latin America with exports to the country falling in products where exports to China increased or were maintained and rising in those where exports to China decreased. However, South America saw stronger growth in products which were also growing in China and in the case of DR-CAFTA US exports fell in products where they were also losing a market in China. This suggests that any trade deflection is concentrated in Mexico.
Using a measure of export deflection from China that is similar to Batista’s CMS method, the increase in US exports to Latin America attributable to deflection to the region from China was 2.2% for Mexico, 1.5% for DR-CAFTA and 1.1% for South America. Given that US exports worldwide grew by over 9% in the period, these are relatively low figures. The overall growth of regional imports in 2025 has been estimated at over 6% (IADB figures) suggesting that deflection of US exports to the region did not contribute to an increase in the relative importance of the US in regional imports.
Rerouting of Chinese goods via Latin America
Empirically, it is difficult to distinguish rerouting with conventional trade data. If Chinese goods are rerouted via Latin America then this can appear as both the deflection of Chinese exports from the US to the region and the diversion of US imports from China to a Latin American country. One indicator of potential rerouting therefore is the coincidence of both deflection and diversion in the same sectors. A more direct indicator would be changes in the Chinese value added incorporated into Latin American exports but such data only becomes available after a considerable time lag in a form that is not sufficiently disaggregated.
As was seen above, trade diversion occurred from China to Mexico, possibly as a result of rerouting of Chinese goods. However, Chinese exports to Mexico grew more slowly than to other parts of the region which suggests that rerouting may not have been a major factor. It is also possible that the transshipment tariffs imposed by the US in July 2025 discouraged rerouting.
Impact on China’s trade with Latin America
Trade destruction
Chinese imports grew in aggregate between the final quarters of 2024 and 2025. Since Chinese trade restrictions did not specifically target Latin America there has been no reason to expect trade destruction to occur. Although Chinese imports from Latin America as a whole grew during the period, this growth was entirely accounted for by South America and imports from Mexico and DR-CAFTA fell. However this was not explained by a contraction in Chinese demand for imports, but rather by a loss of competitiveness by the two sub-regions.
(ii) Trade diversion of Chinese imports from the US to Latin America
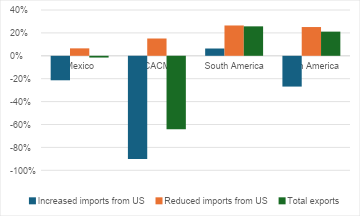
As seen in the trade war with China during the first Trump administration, there is also evidence of Chinese imports being diverted to Latin America in 2025, particularly for agricultural products. During the last quarter of 2025 total Chinese imports from the US were down almost a quarter (23.7%) compared to the same period in 2024, while imports from Latin America were up by over a fifth (21.1%). For products where Chinese imports from the US had fallen, imports from LAC rose even more, by 25.1%, while for products where Chinese imports from the US increased, imports from LAC fell by 26.9%.
The sub-regional level saw differences with significant falls in Chinese imports of products where imports from the US increased, whereas in South America, imports of these products increased. Imports from all three sub-regions increased in products where US exports to China fell over the period (see Figure 8).
Figure 8: Growth of Chinese Imports from Latin America according to growth of imports from US: 2024-5
Latin America’s share of Chinese imports increased from 8.5% to 10% over the period, with 40% of this increase estimated as coming at the expense of the US. The gain in the market share of the region was entirely accounted for by South America whose share increased from 7.6% to 9.3% over the period, while Mexico and Central America saw their share of Chinese imports decline. Over 40% of South America’s gain in the Chinese market was a result of the loss of market share by US exporters (an increase of 0.7 percentage points).
Figure 9 shows that as with exports to the US, there were clear differences between the trends in the three sub-regions. Mexico gained very little as a result of the diversion of Chinese imports from the US, while Central America lost competitiveness relative to the US in the Chinese market. Only South America saw a large increase in exports as a result of import diversion.
Figure 9: Trade policies and Chinese Imports from LAC, 2024-2025 (last quarter)
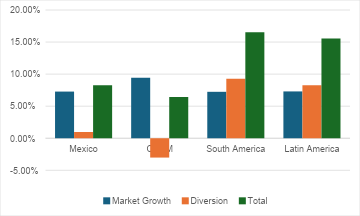
Soybeans account for the greatest part of this diversion of imports to the region. South America’s share of Chinese imports of oil seeds and related products (HS12) increased from 54% in late 2024 to 90% in late 2025. Almost all of this change was accounted for by the decline in Chinese imports from the US, which dropped dramatically as a result of China’s retaliation against the US trade war. Chinese imports of oil seeds from the US were down 97% in the last quarter of 2025 while imports from Latin America increased by almost two-thirds (ITC).
As of August 2025, Latin American countries enjoyed significantly lower tariffs compared to the US in China not only for soybeans but also for meat products, shellfish, fruits and vegetables (ECLAC, 2025, Grafico II.23). In the case of soybeans and oilseeds, the Chinese tariff on imports from Argentina, Brazil, and Uruguay was 3% compared to 23% from the US. Other products faced large differences in tariffs, particularly for those countries including Chile, Costa Rica, Ecuador and Peru that have free trade agreements with China.
This dynamic was reflected in a boom in Chinese soybean imports from South America during 2025, while buyers largely shunned American imports, although these were expected to pick up after an agreement between China and the US to increase imports in late October 2025 (Reuters, 2025)
(i) Deflection of Chinese exports from US to Latin America
It has been pointed out that despite a significant drop in Chinese exports to the US, the overall level of exports from China has not declined. Chinese exports to Africa, the Association of Southeast Asian Nations (ASEAN), Latin America and the EU grew in 2025 leading to a record trade surplus (Wang, 2026). Between the final quarters of 2024 and 2025, Chinese exports to the US fell by 28% while exports to Latin America increased by almost 9%.
Trade with LA has grown less quickly than with the other regions mentioned, suggesting that trade deflection to the region may have been limited. This is consistent with the evidence of Trump’s earlier trade war with China during his first administration (see above).
However, there is evidence of some trade deflection to Latin America. At the two-digit level of the HS-classification of trade, Chinese exports to the region increased by 8.9% between the last quarter of 2024 and the corresponding period in 2025 for those products where Chinese exports to the US fell, while exports to Latin America for products where China was able to maintain or increase exports to the US were unchanged.
Figure 10: Growth of Chinese Exports to Latin America according to Chinese Exports to US, 2024-2025
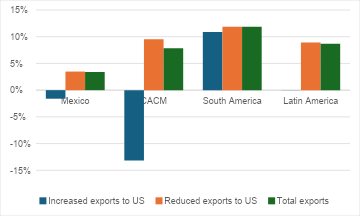
Figure 10 shows that this pattern of Chinese exports was not the same across the three sub-regions. Although total Chinese exports increased to all three regions, Mexico and Central America saw a drop in Chinese exports of products where China was able to maintain or increase its exports to the US and an increase in Chinese exports of products where China was losing markets in the US. This suggests that there may have been some deflection of Chinese exports from the US to those regions. In South America in contrast, Chinese exports grew across the board.
Applying a similar methodology to that used for estimating trade diversion, it is also possible to calculate the extent to which exports have been deflected from the US to LA. Taking the region as a whole, the share of Chinese exports going to LA increased from 7.1% to 7.5% between the last quarters of 2024 and 2025. However, Mexico’s share fell slightly, while that of Central America increased marginally. Of the increased share of Chinese exports going to South America, around 60% could be attributed to deflection of exports from the US market.
From the point of view of the Latin American countries, trade deflection can be estimated to have increased imports from China between 2024 and 2025 by 5.2% in South America, 3.8% in Central America and 4.0% in Mexico.
Rerouting of Chinese exports to the US
As noted above, rerouting can lead to an increase in trade between China and Latin America and can be a factor contributing to apparent deflection of exports to the region. However, as was observed earlier, rerouting does not appear to have occurred on a major scale during 2025.
Overall Impact on Trade Relations with the US and China
This final section compares the relative impact of the changes discussed above on trade relations with the US and China, in terms of the impacts on both imports and exports.
Latin American exports
Latin American exports to China grew faster than exports to the US during 2025. However, there were very distinct patterns in the three sub-regions. In Mexico and Central America total exports to the US grew in value terms, while exports to China declined. In contrast, South American exports to the US fell in value terms while exports to China grew significantly.
Trade diversion of US imports from China played a major role in the growth of Mexican exports and in Central America helped to offset the negative impacts of a shrinking market for the products that the sub-region exports (“trade destruction”). In South America, diversion was minimal and the region’s exports were negatively affected by trade destruction.
There was no significant trade diversion of Chinese imports from the US to either Mexico or Central America, but it did make an important contribution to the growth of South American exports. This was concentrated in agricultural products, particularly soybeans.
Latin American imports
Chinese exports to Latin America as a whole grew almost twice as fast as US exports in 2025. Again, there are contrasting patterns: US exports to Mexico grew slightly faster than Chinese exports, while exports from China to Central and South America grew more rapidly. South America had the highest growth of Chinese exports.
Estimates show that deflections made some contribution to the growth of exports from both the US and China. They also show a higher growth from deflection of Chinese exports from the US to the region, than of US exports from China to Latin America.
In contrast to the situation with exports from Latin America, on the import side, the evidence indicates that links with China became relatively more significant than those with the US in Central as well as South America, but that Mexico increased imports more rapidly from the US.
Conclusion
Overall, the evidence suggests that US trade policies and the retaliatory measures adopted by China promoted closer links with the US in Mexico and Central America and closer links with China in South America. The absolute gain in the value of trade with the US from trade diversion and deflection to Mexico in 2025 came to 11.6 times the gain in trade with China. The corresponding figure for Central America was 2.6 times. In contrast, in South America, the gain from deflection and diversion to China was 14.5 times the gain in trade with the US. This supports the more nuanced view that the effects of US trade policies are not the same across the entire region (Estefan, 2025).
While there is no clear conflict between the protectionist policies of the Trump administration and its geopolitical strategies in Mexico and Central America, in South America contradictions do appear. In the latter the overall economic trend is for closer relations with China which is unlikely to be reversed. Although the US intervention in Venezuela may lead to closer economic ties with the US, this is unlikely to occur elsewhere in the sub-region.
In Mexico, however, the renegotiation of the USMCA is an opportunity for further North American integration in line with a strategy of reducing Chinese influence. Indeed, this is already happening with the imposition of tariffs of up to 50% on a number of goods coming from China, partly in response to US pressure (Webber, 2025). In Central America too, the US continues to enjoy considerable leverage. The recent US trade and investment agreement with El Salvador is also a reflection of efforts by the US government to strengthen its position in the region. There is likely therefore to be further divergence within Latin America in terms of their relations with the US and China.
References
Alfaro, L and D Chor, 2023, A Perspective on the Great Reallocation of Global Supply Chains, VoxEU.org, 28 September.
Batista, J., 2008, “Competition between Brazil and other exporting countries in the US import market: a new extension of constant-market-shares analysis”, Applied Economics, 40: 2477-2487.
Brown,C., 2025, US-China Trade War Tariffs; an up-to-date chart, Washington, Peterson Institute for International Economics available at US-China Trade War Tariffs: An Up-to-Date Chart | PIIE (accessed 2 March 2026).
Cao, E. and Hackson, L., 2026, (China's 2025 soybean imports hit record, fuelled by S. American purchases | Reuters (accessed 2 March 2026).
Douch, M., Du, J. and Vanino, E., 2019. Defying gravity? Policy uncertainty and trade diversion. Lloyds banking centre for business prosperity research paper.
ECLAC, 2025, Perspectivas del Comercio Internacional de América Latina y el Caribe 2025: El comercio internacional en la nueva era de interdependencia instrumentalizad, Santiago: UN.
Edwards, S., 2025, “Latin America: Tariffs and Industrialization” in CEPR, The Economic Consequences of the Second Trump Administration: A Preliminary Assessment, CEPR Press.
Ellis, E., 2025a, “Trump’s Foreign Policy could accelerate China’s advance in Latin America”, The Diplomat, 28 February 2025.
Ellis, E., 2025b, “Prospects for China’s Advance in Latin America during the second Trump administration”, Journal of War and peace Studies, October, pp.49-66.
Estefan, B., 2025, “How Latin America is realigning, Americas Quarterly, 14 October 2025.
Evenett, S. and F. Martin, 2025, Redirecting Chinese exports from the US: Evidence on trade deflection from the first US-China trade war, VoxEU, available at: Redirecting Chinese exports from the US: Evidence on trade deflection from the first US-China trade war | CEPR accessed 2 March 2026.
Fajgelbaum, P., Goldberg, P., Kennedy, P., Khandelwal, A. and Taglioni, D., 2023. The US-China Trade War and Global Reallocations. NBER Working Paper, (w29562).
Gunnella, V., Stamato, G. and Kobayashi, A., 2025. The implications of US-China trade tensions for the euro area–lessons from the tariffs imposed by the first Trump Administration. Economic Bulletin Boxes, 3.
Haberkorn, F. Hoang, T., Lewis, G., Mix, C., and Moore, D., 2024, Global trade patterns in the wake of the 2018-2019 U.S.-China tariff hikes, FEDS Notes. Washington: Board of Governors of the Federal Reserve System, April 12, 2024, https://doi.org/10.17016/2380 7172.3464.
Hakim, P., 2006. Is Washington Losing Latin America?. Foreign Affairs, pp.39-53.
Harrison, C. and G. Gerbaud, 2025, Tracking Trump and Latin America: Trade—Tariffs Threatened on Mexico over Water Sharing, Americas Society/Council of the Americas, available at Tracking Trump and Latin America: Trade—Tariffs Threatened on Mexico over Water Sharing | AS/COA (accessed 2 March 2026).
Hinrichs Foundation, 2025, Breaking down US$450 billion of trade destruction from US tariffs.
Hoang, T., and G. Lewis, 2024. As the US is Derisking from China, Other Foreign US Suppliers Are Relying More on Chinese Imports, FEDS Notes. Washington: Board of Governors of the Federal Reserve System, August 02, 2024, https://doi.org/10.17016/2380-7172.3498.
IADB, 2025, Regional Opportunities amid Global Shifts, 2025 Latin American and Caribbean Macroeconomic Report, Washington DC: inter-American Development Bank.
IMF, (2025), International Trade in Goods, available at https://data.imf.org/en/datasets/IMF.STA:ITG (accessed 20 October 2025)
International Trade Centre (2026), Trade Statistics, available at https://www.intracen.org/resources/data-and-analysis/trade-statistics#scroll-to-section-overview (accessed 02/11/2026)
Iyoha, E., Malesky, E., Wen, J., Wu, S.J. and Feng, B., 2025. Exports in Disguise?: Trade Rerouting during the US-China Trade War. Centre for Inclusive Trade Policy.
Jenkins, R., 2010, “China’s global growth and Latin American Exports” in A. Santos-Paulino and G. Wan (eds.), The Rise of China and India: Impacts, Prospects and Implications, Palgrave Macmillan, 2010, 220-240.
Jenkins, R., 2014, Chinese Competition and Brazilian Exports of Manufactures. Oxford Development Studies, 42(3), pp.395-418, 2014
Jenkins, R., 2025, “Chinese foreign direct investment in Latin America: what we know and what we don’t know” in E. Dussel Peters, China’s Overseas Direct Foreign Investment in Latin America and the Caribbean: Debates and new case studies, Mexico City: Unión de Universidades de América Latina, 2025: 7-51.
Laborde, D. and Piñeiro, V., 2019, Trade Tensions: implications for Latin America and the Caribbean, Washington DC, International Food Policy Research Institute.
Long, T., 2016. The United States and Latin America: The overstated decline of a superpower. The Latin Americanist, 60(4), pp.497-524.
McFields, A., 2025, “Trump is breaking China’s foothold in Latin America”, The Hill 4/7/25, available at Trump is breaking China’s foothold in the Americas accessed 25/2/26.
Milani, L.P., 2021. US Foreign Policy to South America since 9/11: Neglect or Militarisation?. Contexto Internacional, 43, p.1.
Moreira, M.M., Blyde, J.S., Martincus, C.V., Dolabella, M. and de Artiñano, I.M., 2022. The reorganization of global value chains: what’s in it for Latin America and the Caribbean? IDB Working Paper Nº IDB-WP-01414.IADB
Nicita, A. 2019, Trade and trade diversion effects of United States tariffs on China, UNCTAD Research Paper No. 37 UNCTAD/SER.RP/2019/9.
Segal, S., 2025, “China’s inroads are encouraging closer ties with the US”, Americas Quarterly, 14 October 2025.
Urdinez, F., 2025, Economic Displacement: China and the end of US primacy in Latin America, Cambridge University Press.
US, 2025, National Security Strategy of the United States of America, Washington DC
US Trade Data, (2026), https://usatrade.census.gov/data/Perspective60/Dim/dimension.aspx?ReportId=46 (accessed 02/20/2026)
Utar, H., Zurita, A.C. and Torres, L., 2025. The US-China trade war and the relocation of global value chains to Mexico. Review of Economics and Statistics, pp.1-47.
Wang, J., 2026, https://theconversation.com/have-us-tariffs-failed-to-bite-chinas-trade-surplus-hits-a-record-us-1-2-trillion-273658 (accessed 2 March 2026).
Wang, M. and Hannan, M.S.A., 2023. Trade diversion effects from global tensions—higher than we think. International Monetary Fund.
Webber, J., 2025, “Mexico imposes tariffs of up to 50% on Chinese Goods”. Financial Times, 11 December 2025.
Footnotes
1: Urdinez uses LA exports rather than total trade (exports + imports) on the grounds that exports contribute to the foreign exchange which is available to the region.
2: Chinese data on outward investment is particularly problematic (see Jenkins, 2025).
3: Nicita (2019): “Mexico’s increase in exports to the United States due to tariffs on China are quantified to be about US$ 3.5 billion, mostly in the agri-food, transport equipment and electrical machinery sectors”.
4: Jenkins (2010) found that the DR-CAFTA countries’ exports to the US had been particularly negatively affected after China joined the WTO in 2001 so that they stood to benefit from new restrictions on Chinese products.
5: Moreira et. al. (2022) did not find that Central American exports of products on which the US increased tariffs on China grew faster than those products that were not affected between 2017 and 2019.
6: In February 2026 the US Supreme Court declared the President could not impose these “reciprocal tariffs” under the International Economic Emergency Powers Act. He immediately imposed an across the board tariff of 10% on imports, then raised it to 15%, under Section 122 of the Trade Act of 1974 but this is for a limited duration of 150 days.
7: The countries which are predicted to have negative trade diversion are Costa Rica, Nicaragua, Bolivia, Ecuador, Peru and Venezuela. While the first two are amongst the Latin American countries facing the highest levels of effective tariffs in the US, the others face relatively low tariffs making the negative estimates difficult to explain (see Figure 4).
8: Again, it should be noted the country which is likely to have experienced the largest positive effects of trade diversion, Mexico, was not included in the analysis.
9: US imports from countries other than China increased over the period.
10: The fact that there was trade creation between the US and Mexico despite the overall fall in US imports from the world, can be explained by a growth in US imports of those products which Mexico specializes in exporting.

